|
| District wise Rainfall(mm) Date:
19/04/2024 |
Export to Excel :  |
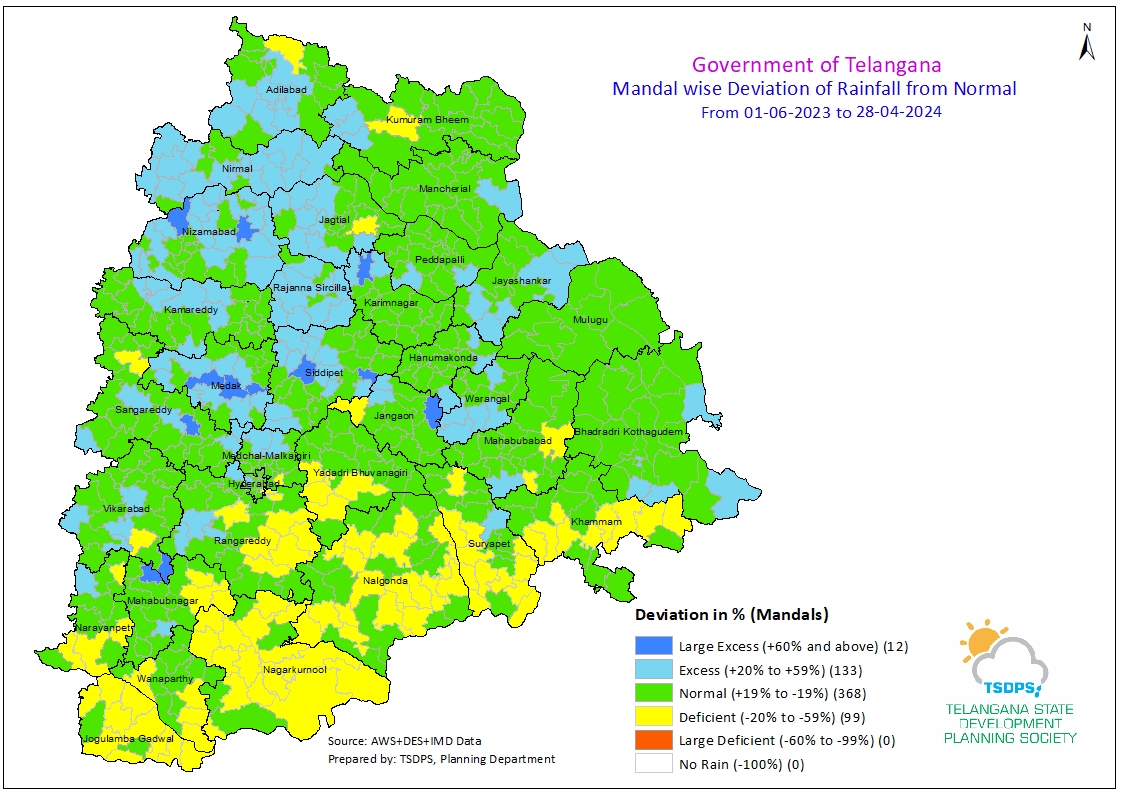
| No. of Districts with Rainfall Status |
Large Excess - 0 |
Excess - 6 |
Normal - 24 |
Deficient - 3
| Large Deficient - 0
|
|
| SNO |
Districts |
Today's Rainfall(mm) |
Cumulative Rainfall (mm) from 01/06/2023 to 19/04/2024 |
| Actual |
Normal |
Deviation(%) |
Actual |
Normal |
Deviation(%) |
Status |
| 1 |
Adilabad |
0.0 |
0.4 |
-100 |
1291.0 |
1131.4 |
14.0 |
Normal |
| 2 |
Kumuram Bheem |
0.0 |
0.6 |
-100 |
1215.0 |
1158.9 |
5.0 |
Normal |
| 3 |
Mancherial |
0.0 |
0.5 |
-100 |
1049.7 |
1067.5 |
-2.0 |
Normal |
| 4 |
Nirmal |
0.9 |
0.1 |
800 |
1320.2 |
1041.7 |
27.0 |
Excess |
| 5 |
Nizamabad |
0.1 |
0.1 |
0 |
1253.9 |
994.1 |
26.0 |
Excess |
| 6 |
Jagtial |
0.4 |
0.2 |
100 |
1133.9 |
989.8 |
15.0 |
Normal |
| 7 |
Peddapalli |
0.0 |
0.3 |
-100 |
1080.0 |
1014.2 |
6.0 |
Normal |
| 8 |
Jayashankar |
0.0 |
0.2 |
-100 |
1343.3 |
1070.5 |
25.0 |
Excess |
| 9 |
Bhadradri Kothagudem |
0.0 |
0.1 |
-100 |
1214.0 |
1130.8 |
7.0 |
Normal |
| 10 |
Mahabubabad |
0.0 |
0.1 |
-100 |
936.6 |
976.2 |
-4.0 |
Normal |
| 11 |
Warangal |
0.0 |
0.2 |
-100 |
1161.2 |
1006.4 |
15.0 |
Normal |
| 12 |
Hanumakonda |
0.0 |
0.3 |
-100 |
1043.8 |
974.5 |
7.0 |
Normal |
| 13 |
Karimnagar |
0.0 |
0.3 |
-100 |
1006.9 |
886.7 |
14.0 |
Normal |
| 14 |
Rajanna Sircilla |
0.1 |
0.1 |
0 |
1103.8 |
875.1 |
26.0 |
Excess |
| 15 |
Kamareddy |
0.1 |
0.2 |
-50 |
1056.3 |
971.3 |
9.0 |
Normal |
| 16 |
Sangareddy |
0.0 |
0.4 |
-100 |
919.3 |
813.1 |
13.0 |
Normal |
| 17 |
Medak |
0.0 |
0.5 |
-100 |
1034.4 |
821.2 |
26.0 |
Excess |
| 18 |
Siddipet |
0.0 |
0.2 |
-100 |
913.3 |
746.7 |
22.0 |
Excess |
| 19 |
Jangaon |
0.0 |
0.6 |
-100 |
889.5 |
854.3 |
4.0 |
Normal |
| 20 |
Yadadri Bhuvanagiri |
0.0 |
0.8 |
-100 |
654.1 |
710.3 |
-8.0 |
Normal |
| 21 |
Medchal-Malkajgiri |
0.8 |
0.7 |
14 |
795.5 |
764.3 |
4.0 |
Normal |
| 22 |
Hyderabad |
0.6 |
1.6 |
-63 |
794.2 |
794.5 |
0.0 |
Normal |
| 23 |
Rangareddy |
1.4 |
0.6 |
133 |
659.8 |
689.5 |
-4.0 |
Normal |
| 24 |
Vikarabad |
0.2 |
0.6 |
-67 |
833.9 |
759.2 |
10.0 |
Normal |
| 25 |
Mahabubnagar |
0.2 |
0.6 |
-67 |
573.1 |
611.6 |
-6.0 |
Normal |
| 26 |
Jogulamba Gadwal |
0.0 |
0.6 |
-100 |
385.3 |
549.6 |
-30.0 |
Deficient |
| 27 |
Wanaparthy |
0.0 |
0.6 |
-100 |
539.9 |
601.0 |
-10.0 |
Normal |
| 28 |
Nagarkurnool |
0.2 |
0.6 |
-67 |
443.7 |
612.1 |
-28.0 |
Deficient |
| 29 |
Nalgonda |
0.0 |
0.4 |
-100 |
533.0 |
673.5 |
-21.0 |
Deficient |
| 30 |
Suryapet |
0.0 |
0.1 |
-100 |
638.0 |
750.2 |
-15.0 |
Normal |
| 31 |
Khammam |
0.0 |
0.2 |
-100 |
817.9 |
980.1 |
-17.0 |
Normal |
| 32 |
Mulugu |
0.0 |
1.0 |
-100 |
1416.5 |
1297.1 |
9.0 |
Normal |
| 33 |
Narayanpet |
0.7 |
0.3 |
133 |
551.9 |
590.4 |
-7.0 |
Normal |
|
State Average |
0.2 |
0.4 |
-50 |
924.1 |
885.1 |
4.0 |
Normal |
|

